Plot Generation
Requirements
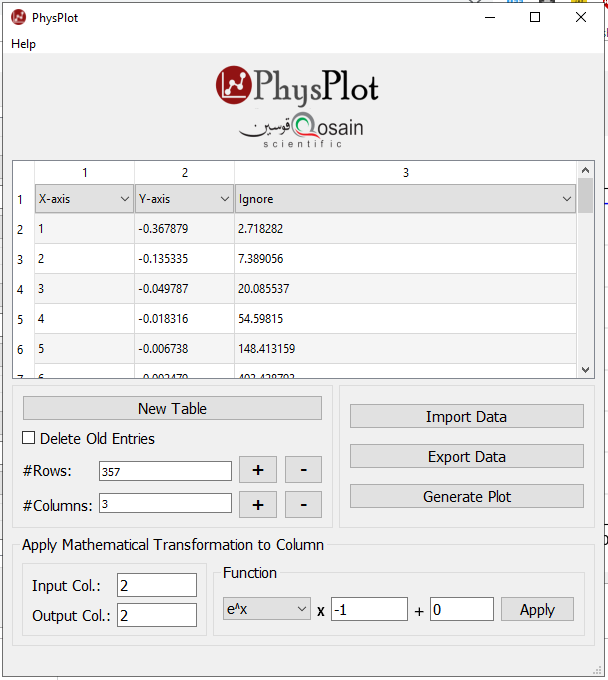
To generate a plot, assign exactly one X-axis column and one Y-axis column.
Generate plot flow
Click Generate Plot in the main window.
PhysPlot opens a configuration window.
PhysPlot opens the plot window.
Plot window
The plot window includes a matplotlib navigation toolbar (pan, zoom, save) and draws:
Main data series
Optional error bars (if Xerr/Yerr columns are assigned)
Title and axis labels
Legend entry