Getting Started
Main window preview
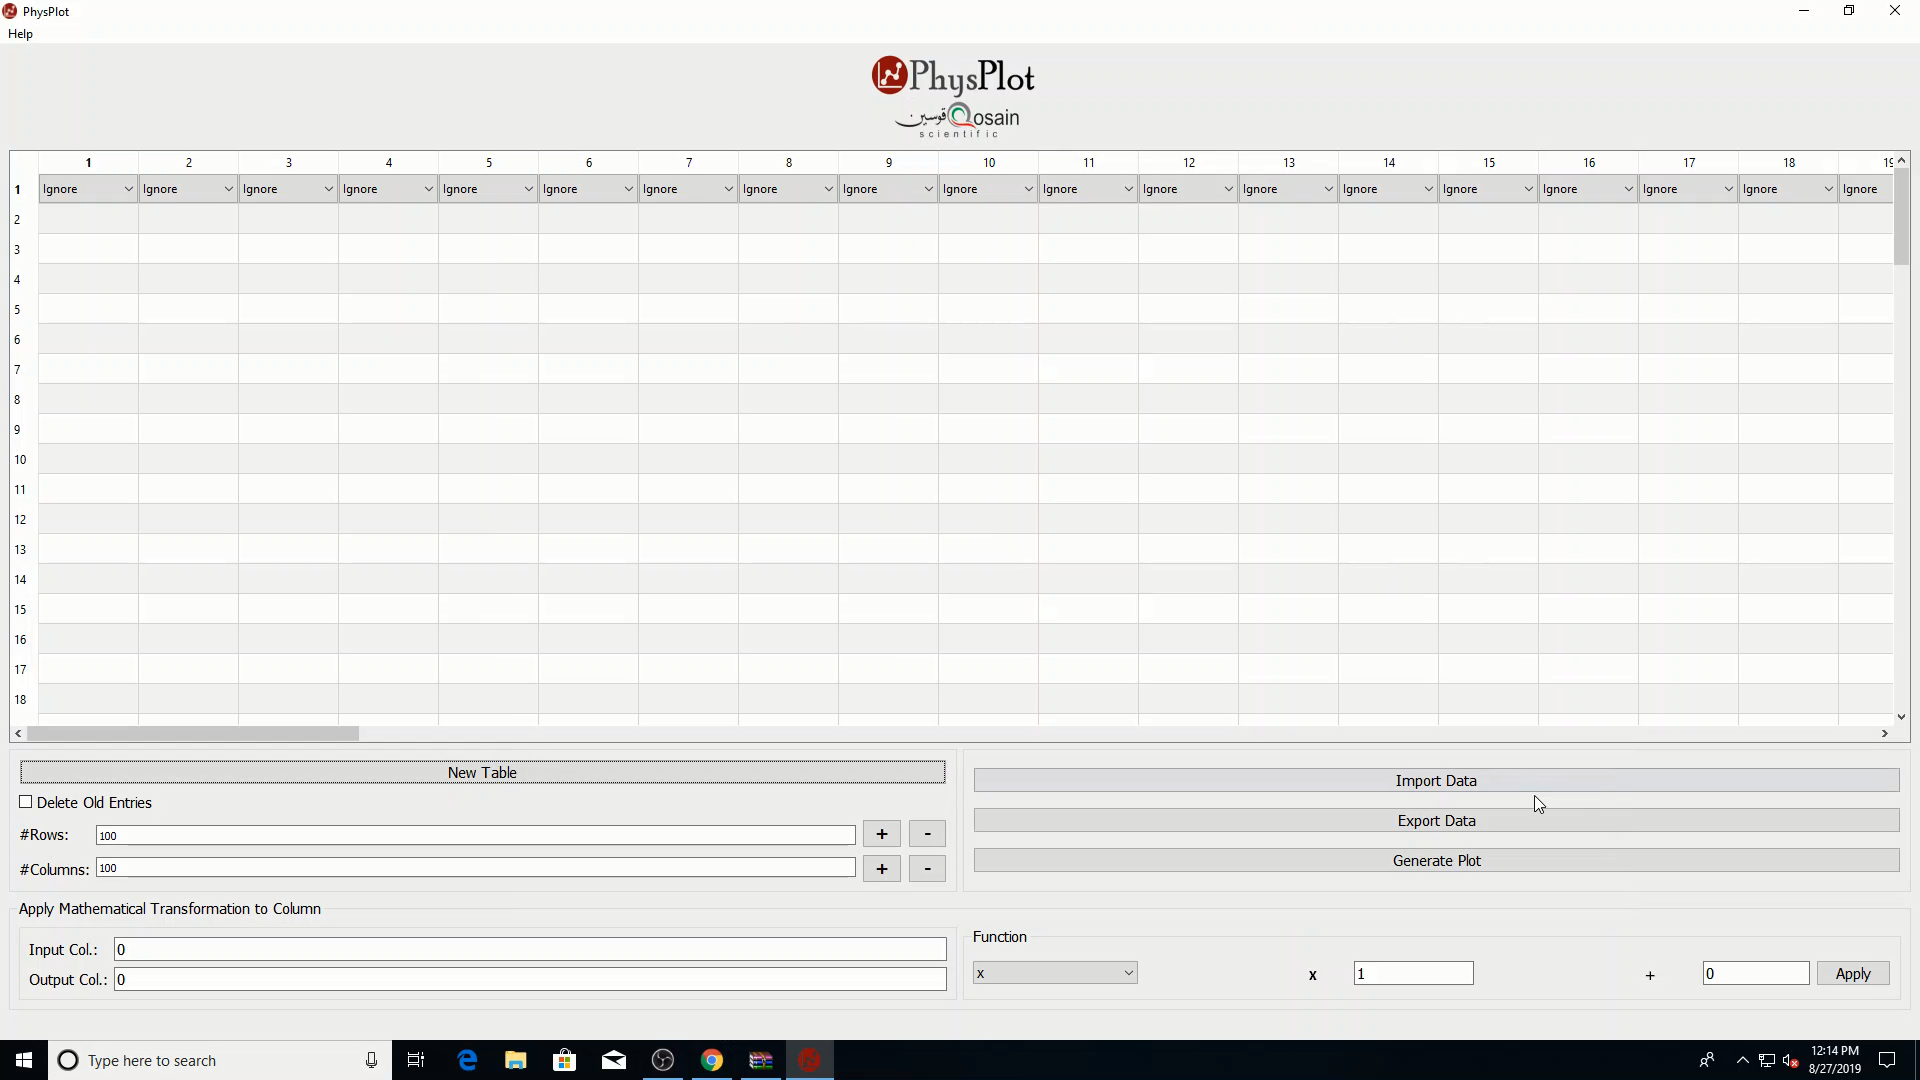
Quick workflow
Launch PhysPlot.
Import data or enter values manually in the table.
Assign each relevant column role (X-axis, Y-axis, Xerr, Yerr) using the top-row dropdowns.
Click Generate Plot.
Configure plot style/fit options in the config window and inspect the generated plot window.