Plot Customization
For a full step-by-step flow, see GUI Walkthrough — Generating and Formatting a Plot.
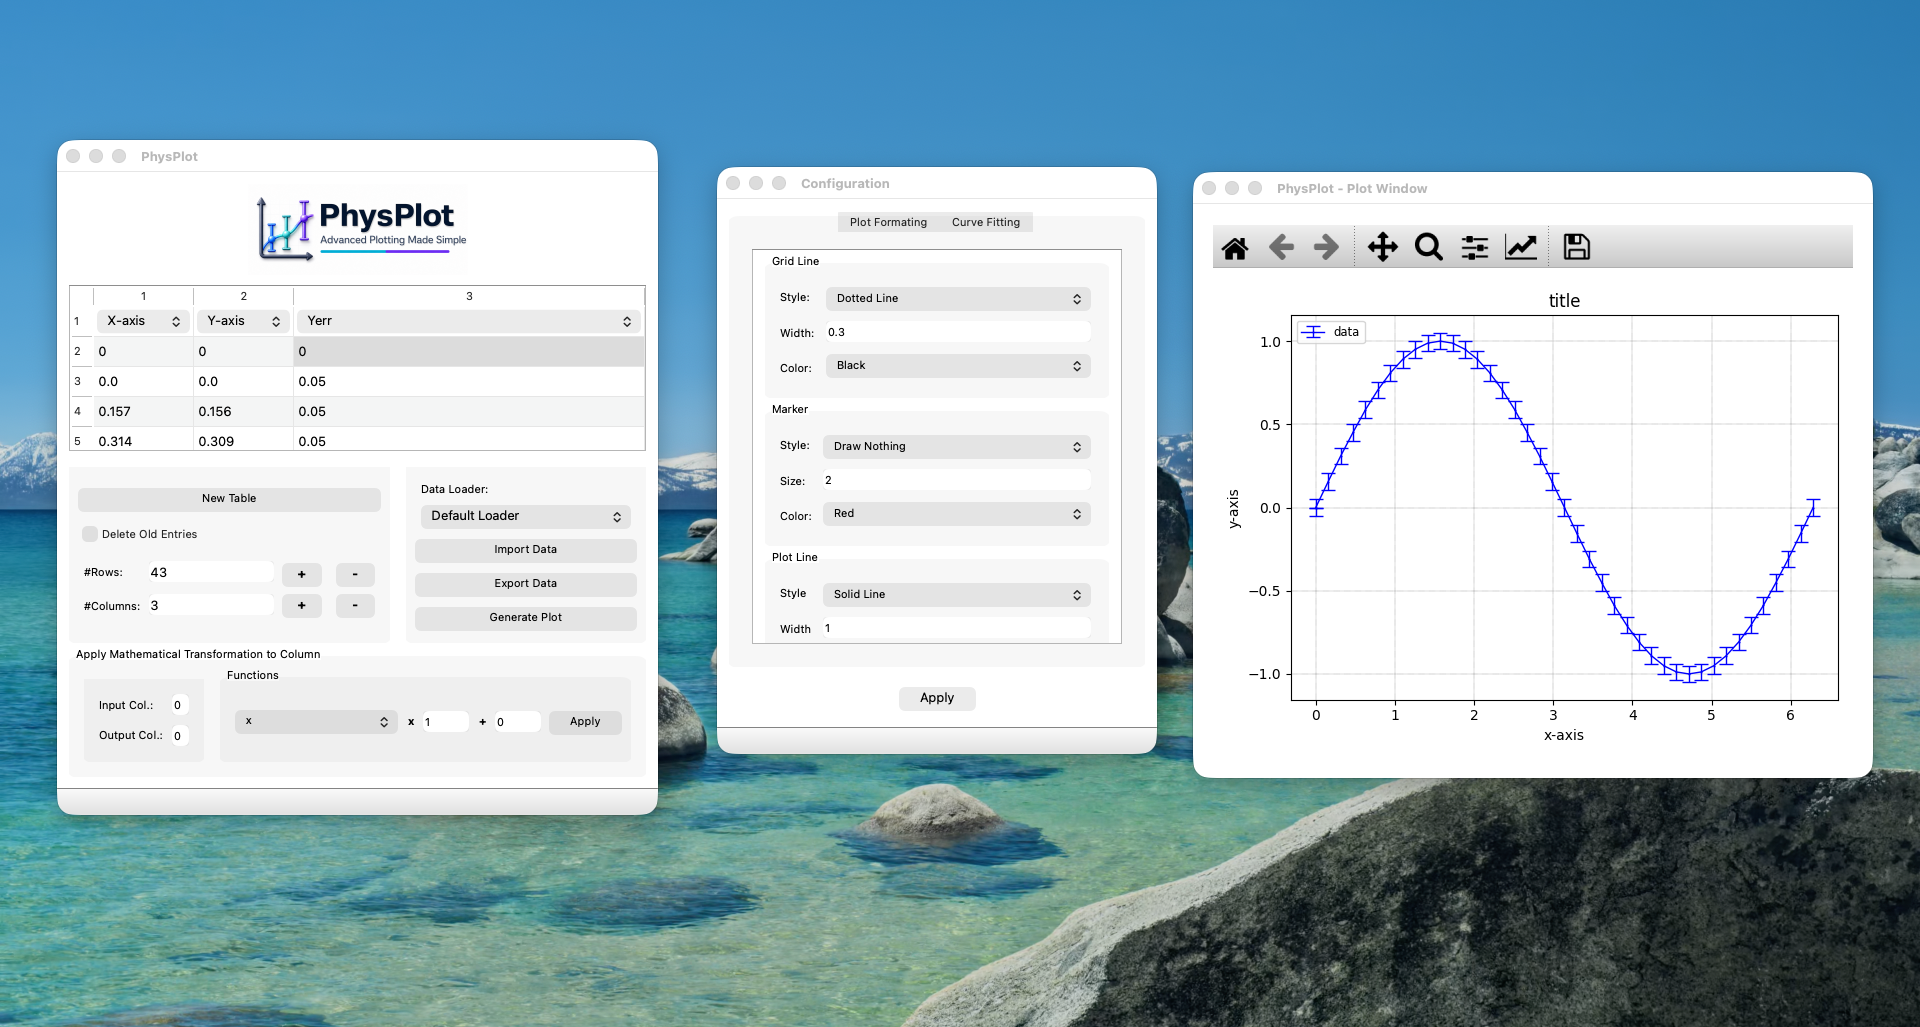
Configuration window options
PhysPlot’s plot configuration window lets you control:
Grid: style, width, color
Marker: style, size, color
Line: style, width, color
Plot labels: title, x-label, y-label, legend label
Marker style options
Point, Pixel, Circle, Triangle-Down, Triangle-Up, Triangle-Left, Triangle-Right, Tri-Down, Tri-Up, Tri-Left, Tri-Right, Octagon, Square, Pentagon, Star, Hexagon1, Hexagon2, Plus, x, Diamond, Thin-Diamond, V-Line, H-Line, Draw Nothing.
Line style options
Solid Line, Dashed Line, Dash-Dotted Line, Dotted Line, Draw Nothing.
Color options
Blue, Green, Red, Cyan, Magenta, Yellow, Black, White.